


Jun 3, 2020
3min read
Unveiling Data Secrets: Exploratory Data Analysis with Pandas Profiling
An effective quick process to explore data.
Exploratory Data Analysis is the process of exploring data, generating insights, testing hypotheses, checking assumptions and revealing underlying hidden patterns in the data.
Explanatory data analysis (EDA) is an approach to analyse data sets to summarize the main characteristics of the data sets often through visualization. It is often one of the most important step involved in data analysis which is implemented before the use of any statistical modeling.
EDA does not have a fixed set of rules and its application varies from one dataset to the other depending on how relevant an element is. EDA mostly revolves under specific statistical methods like creating plots, histograms, correlation matrix and much more.
EDA lets us identify and explore:
The presence of missing values and duplicates.
Dataset statistics like number of features, types of features (Categorical, numerical, boolean etc).
The presence of outliers or other anomalies.
Visualise how sparse features are with respect to each other.
Identify the most influential variables.
All of this might seem to be very extensive which it is. EDA is like a bridge between the actual data and modeling. What if I told you that instead of typing code for each iteration of an EDA procedure you could get all of the above mentioned good stuff with just a single line of code?
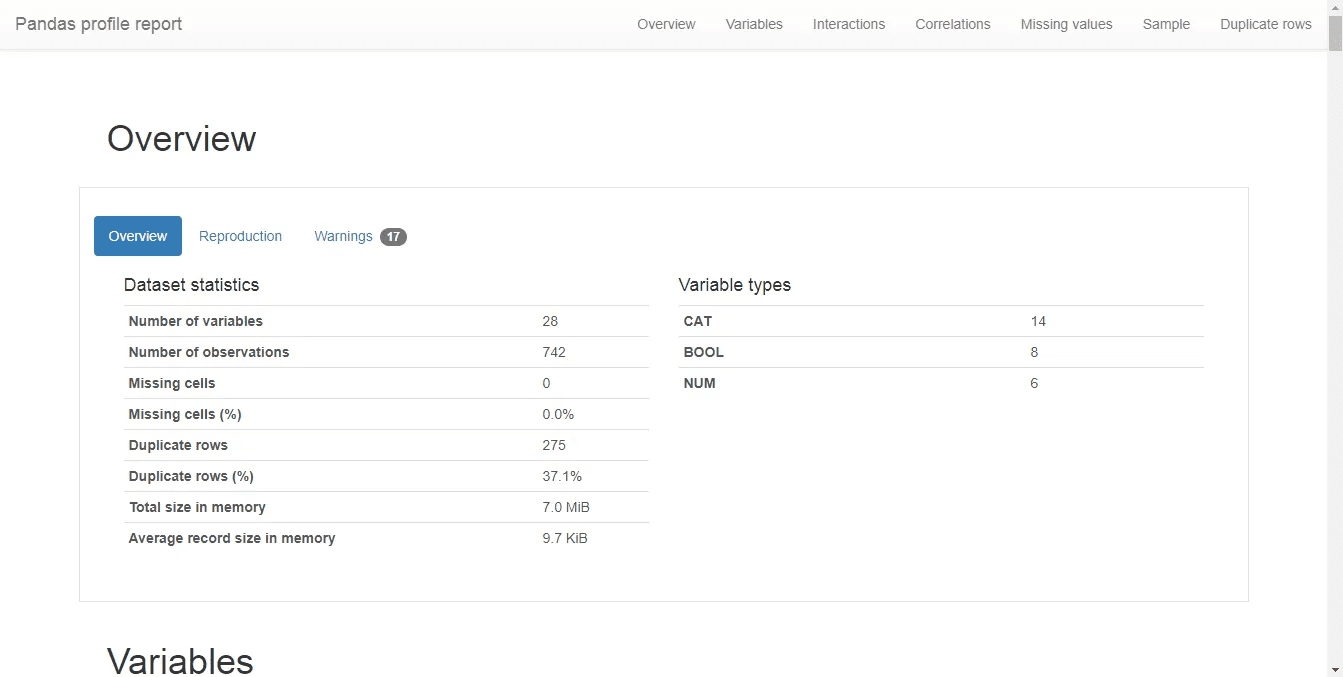
Pandas profiling is an open source Python module through which we could get a birds overview of our dataset with just a single line of code. It does all the hardwork for us from visualisation to understanding the distribution of each variable.
It also lets us generate interactive web reports which can be used to present the overview of the dataset quickly to any person irrespective of his/her technical skills. In short even a layman could understand it.
Let’s get started with how to use pandas profiling.
We first need to install the module in our environment.
We now have to run the following code to generate the report.
The code at line 4 generates the profile in the jupyter notebook itself and the code at line 5 creates a new .html file stored in your working folder. Upon opening the file we get to see the overview of the dataset.
Like many good things Pandas profiling is computationally expensive for large datasets. The following code disables expensive computations (such as correlations and dynamic binning). Use the following syntax:
We now can perform EDA quite easily using pandas profiling with just a single line of code. Always note that this isn’t the only thing you can do during EDA but also try to do this normally using basic pandas and visualisation using matplotlib or seaborn etc.
To know more about pandas profiling check out this link.